The Empirical Rule Calculator
Empirical or 68-95-99.7 Rule Calculation
What is The Empirical Rule?
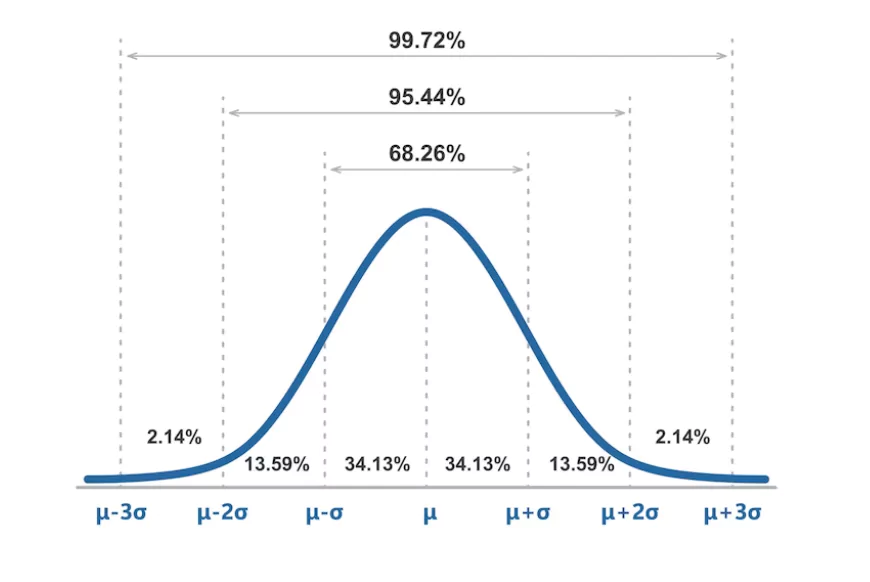
The Empirical Rule is like a helpful guide for understanding how data is spread out in a group. Imagine the data is shaped like a bell. The rule says:
Around 68% of the data is usually close to the average (mean).
About 95% of the data is within two average-sized steps away from the average.
Almost all of the data, around 99.7%, is within three average-sized steps away from the average.

What is The Empirical Rule Calculator?
Now, an Empirical Rule Calculator is like a tool that does the math for you. It figures out these percentages and helps you see how much of your data is likely to be in different ranges from the average.
How to Apply the Rule?
For 68% of the data: The range is mean ± 1 standard deviation.
For 95% of the data: The range is mean ± 2 standard deviations.
For 99.7% of the data: The range is mean ± 3 standard deviations.
How to Use The Calculator?
Gather Your Data
Start by collecting the numbers or values you want to analyze. These could be test scores, heights, or anything where you want to see how spread out the values are.
Input Your Data
Enter your numbers into the Empirical Rule Calculator. There might be spaces or boxes where you can type in each value.
Find the Average (Mean)
The calculator will calculate the average or mean of numbers. This is like finding the middle point.
Calculate Standard Deviation
The calculator will also compute something called the standard deviation. It’s a measure of how spread out your numbers are from the average. The bigger the standard deviation, the more spread out your data.

